
The downward pressure is losing momentum. We may see a change in the direction of Bit.Cash in the near future.
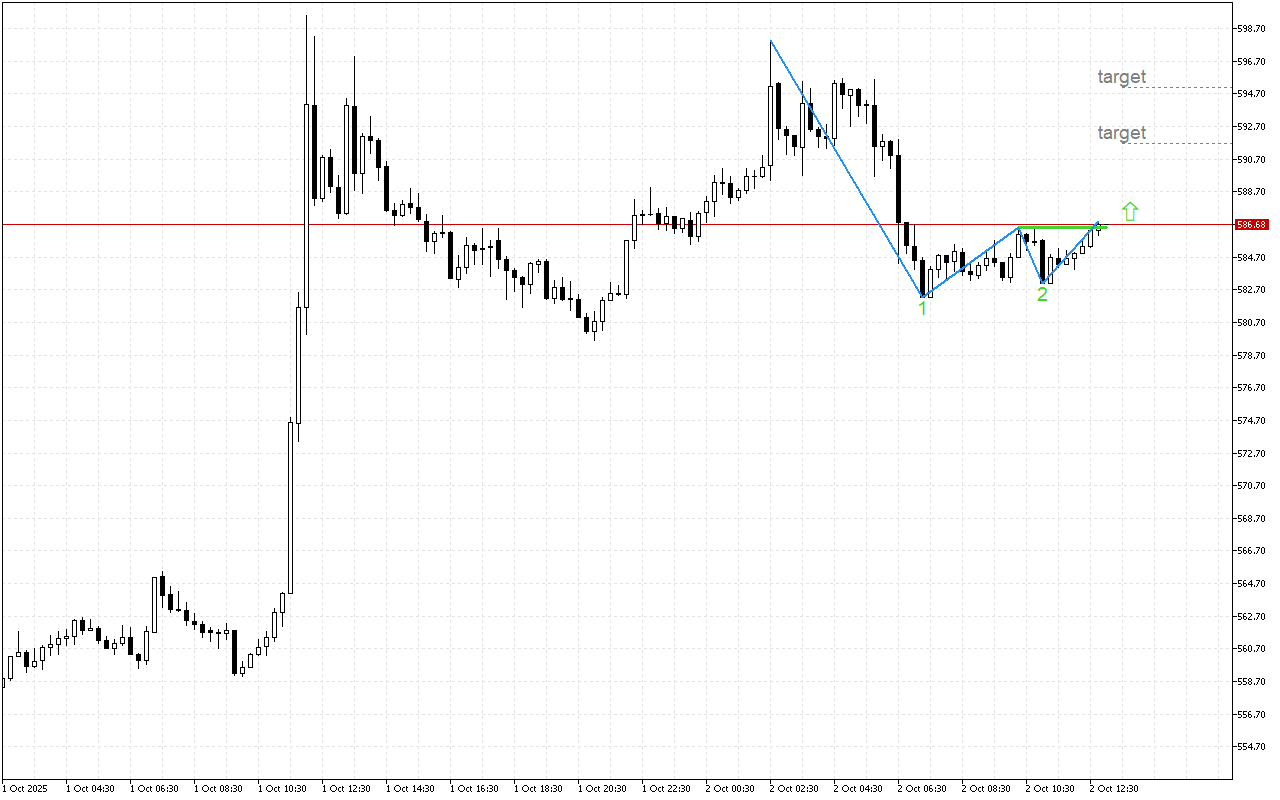
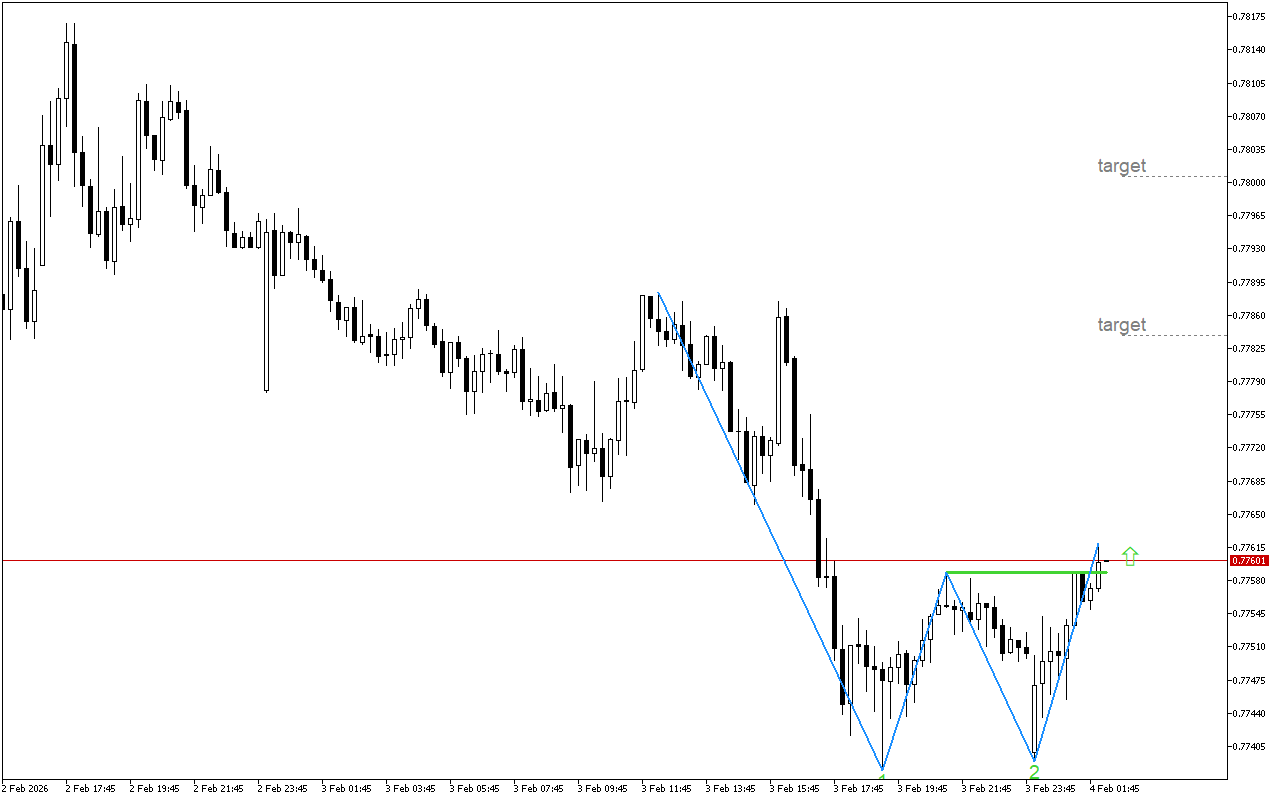
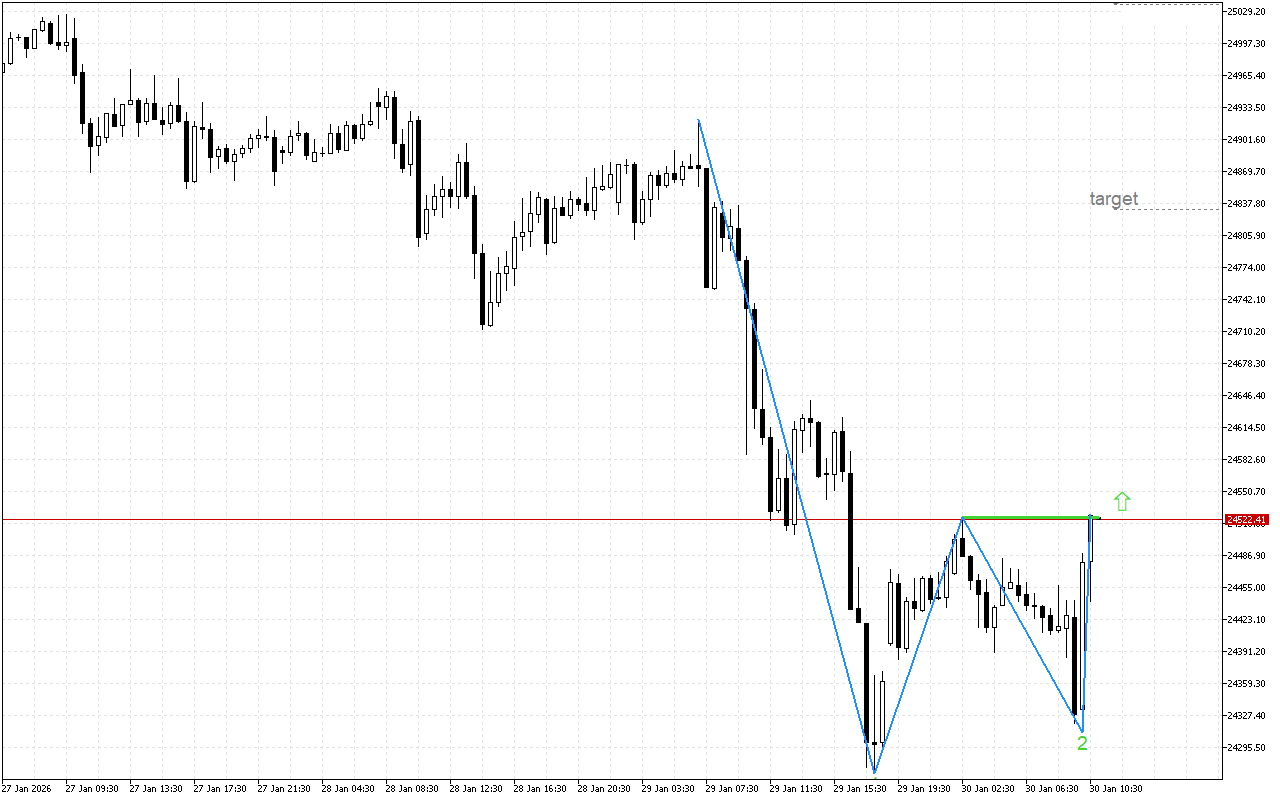
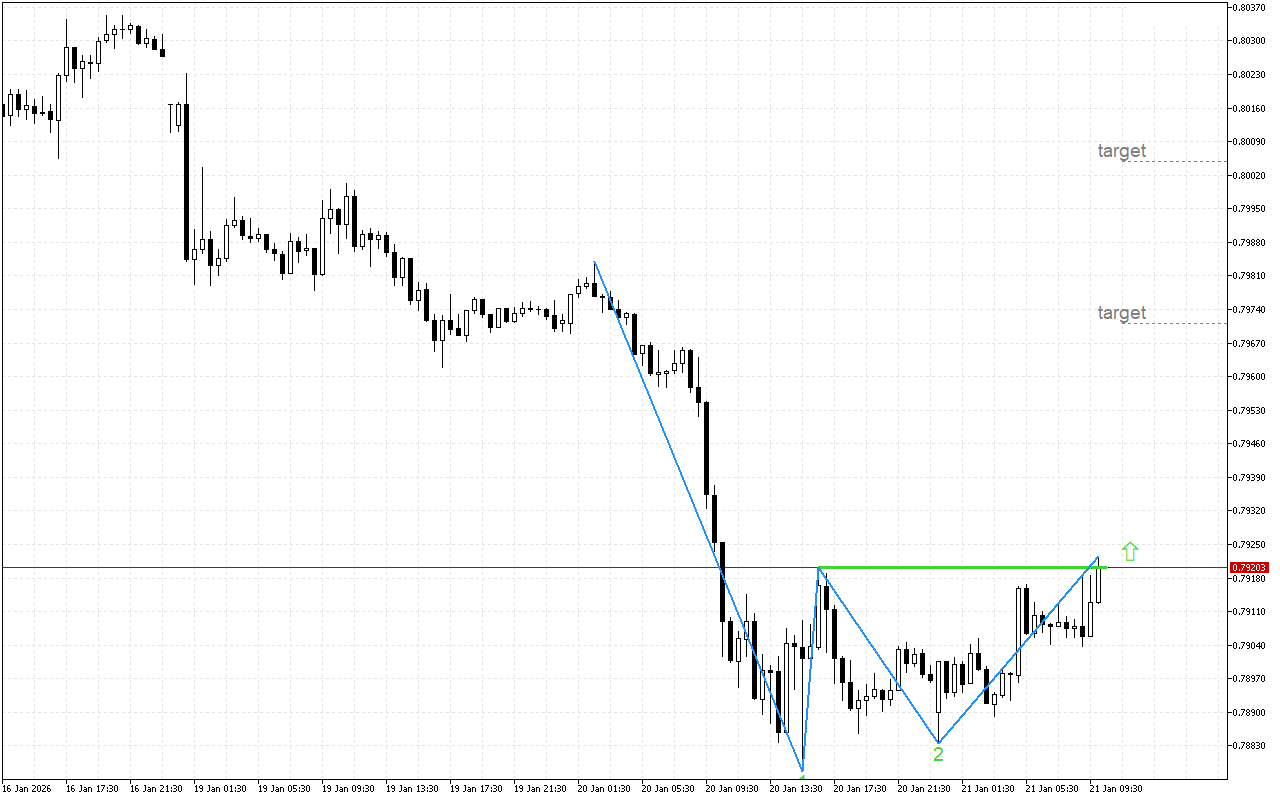
A Double Bottom pattern is being formed on the chart. The key element to confirm the pattern is the breakdown of the neck line, which is drawn through the high points between the two troughs at the level 586.51. The first scenario assumes that the price will consolidate above the neckline and continue to move upward, confirming the reversal. In the second scenario, a pullback below the neckline is possible.
The strategy for Bit.Cash should embrace long positions based on this graphical representation. A trader can enter the market either at the current prices or when return to the marked resistance level is implemented.
📌 Entry: 586.70
✔️ First target: 591.66
✔️ Second target: 595.09
❌ Stop order: 582.22