
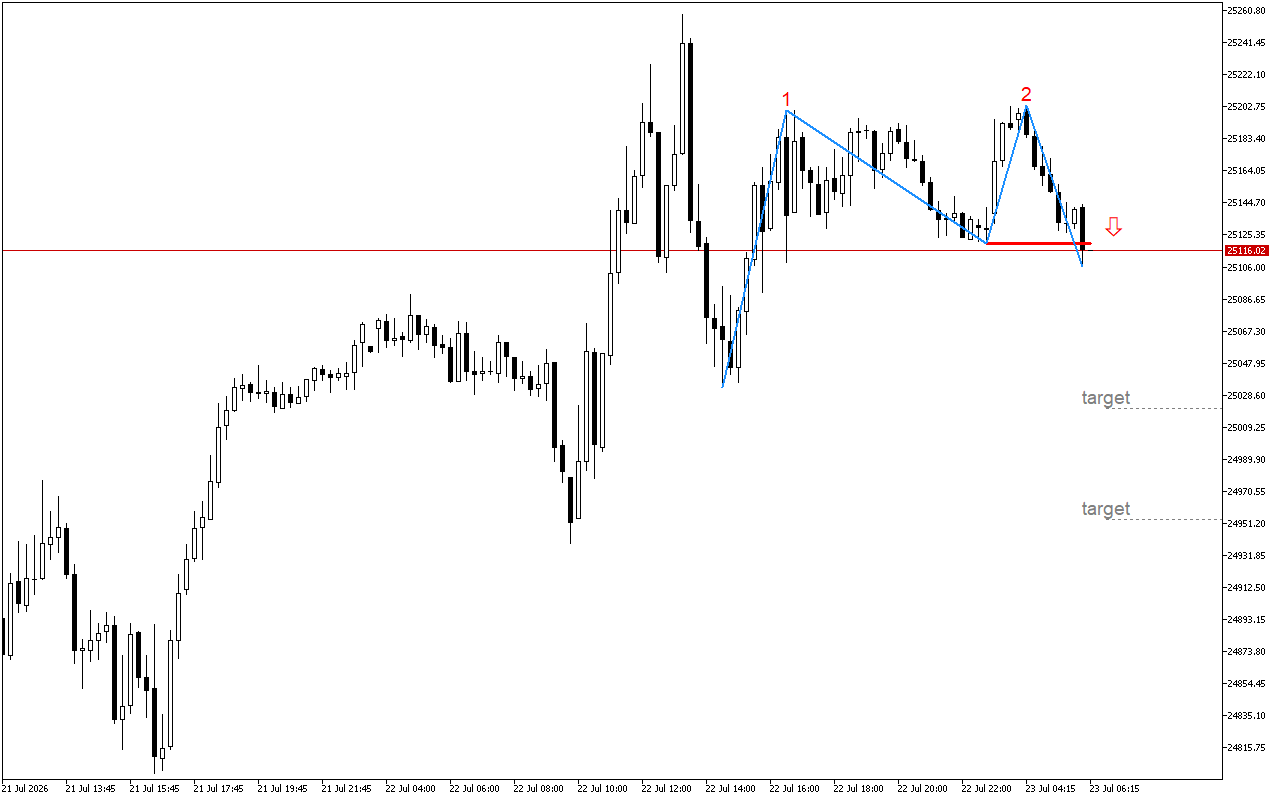
DAX 40 M15: A reversal pattern has been formed
The DAX 40 chart shows signs of weakening of the current upward movement.A classic Double Top reversal pattern is being formed on the chart. The breakdown of the neckline at…

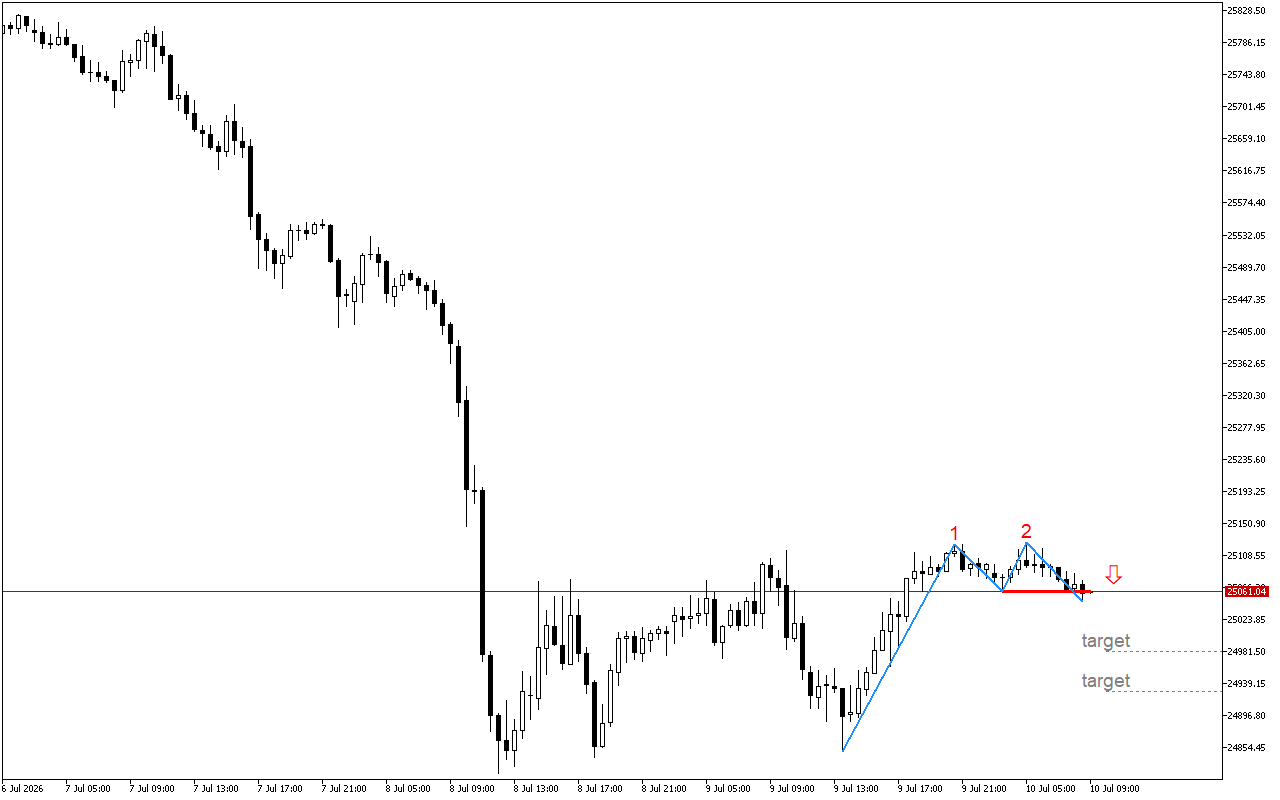
DAX 40 M30: After the formation of two tops of a technical pattern, the price breaks the neckline
The DAX 40 chart shows the signs of weakening upward momentum. The formed patterns indicate a possible slowdown in growth momentum and an increase in the probability of a correction…

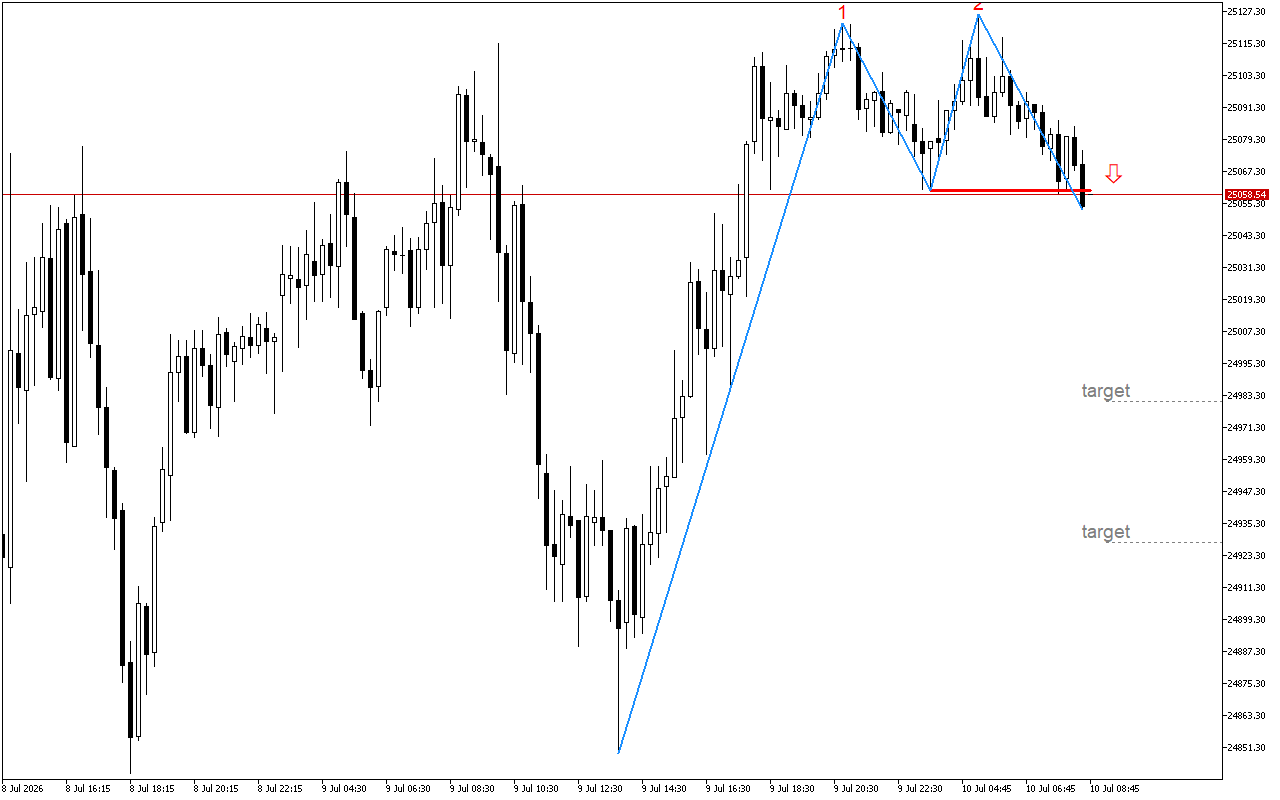
DAX 40 M15: A reversal pattern has been formed
The DAX 40 chart shows signs of weakening of the current upward movement.A classic Double Top reversal pattern is being formed on the chart. The breakdown of the neckline at…

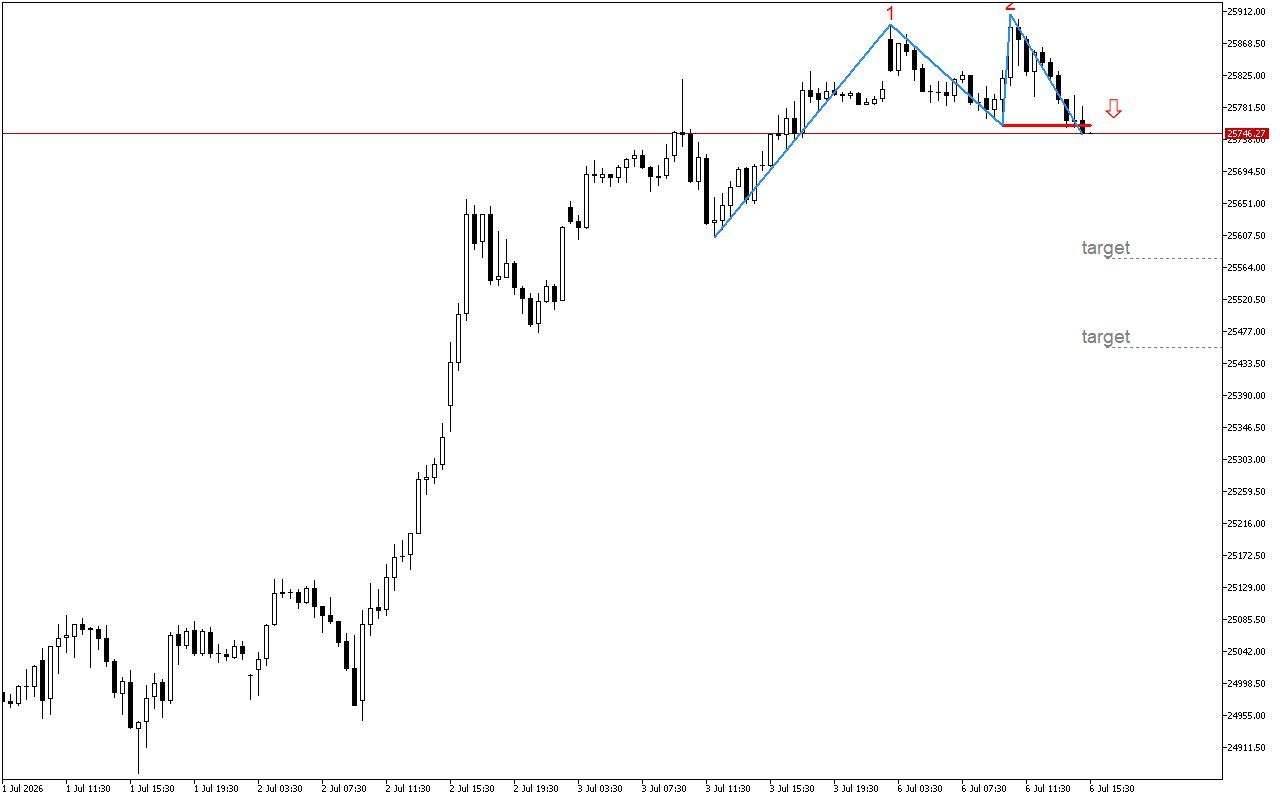
DAX 40 M30: After the formation of two tops of a technical pattern, the price breaks the neckline
The DAX 40 chart shows the signs of weakening upward momentum. The formed patterns indicate a possible slowdown in growth momentum and an increase in the probability of a correction…

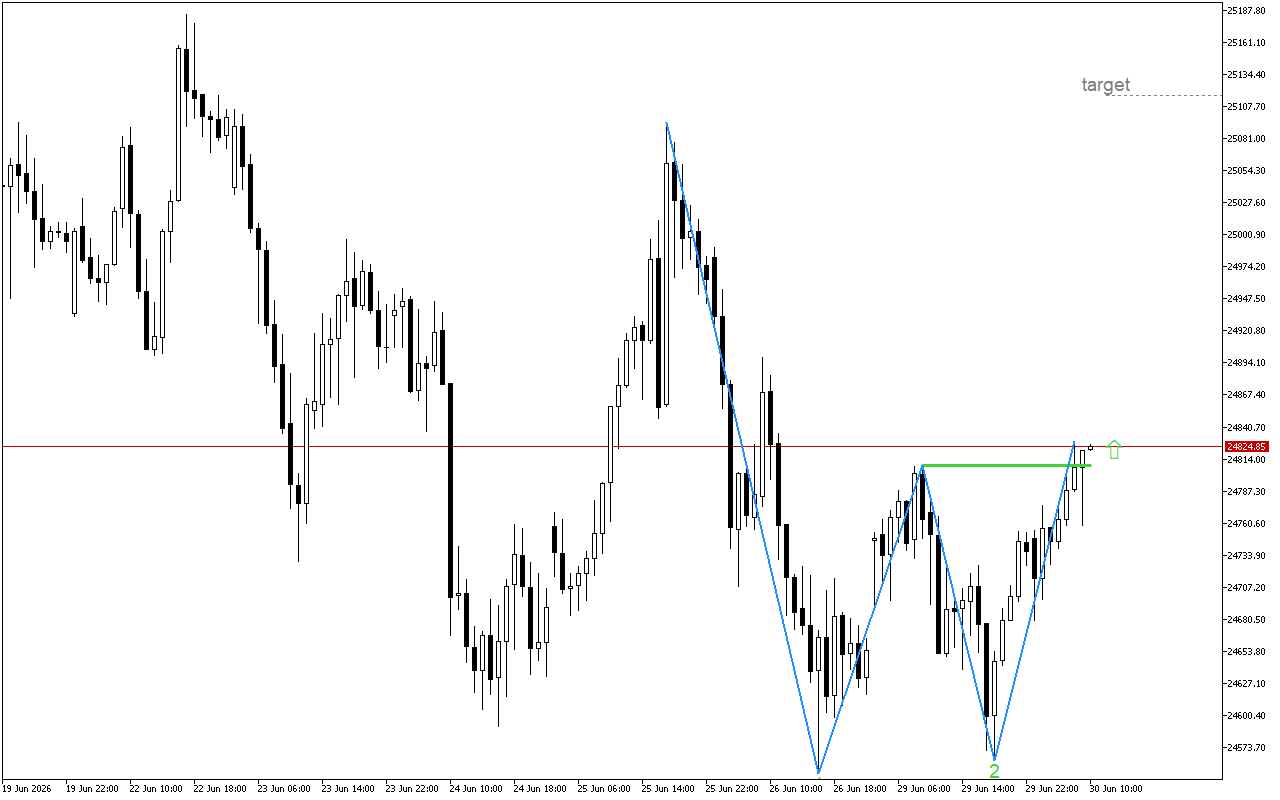
DAX 40 H1: The pattern marked on the chart indicates a possible upward reversal
The downward pressure is losing momentum. We may see a change in the direction of DAX 40 in the near future.A Double Bottom pattern has formed on the chart, indicating…

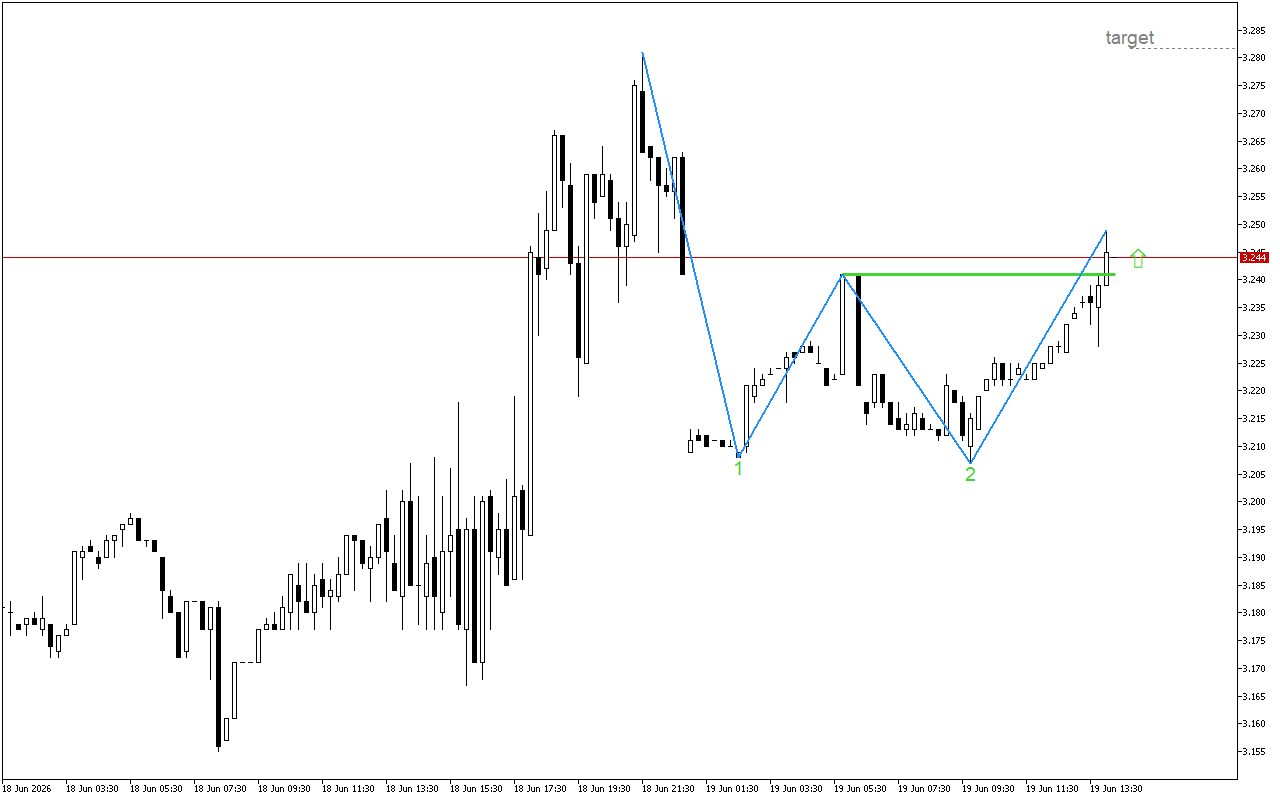
Natural Gas M15: The graphic pattern signals a change in market sentiment
In the current timeframe, there is a decrease in the selling interest. This may lead to the reversal of Natural Gas.A Double Bottom pattern has formed on the chart, indicating…

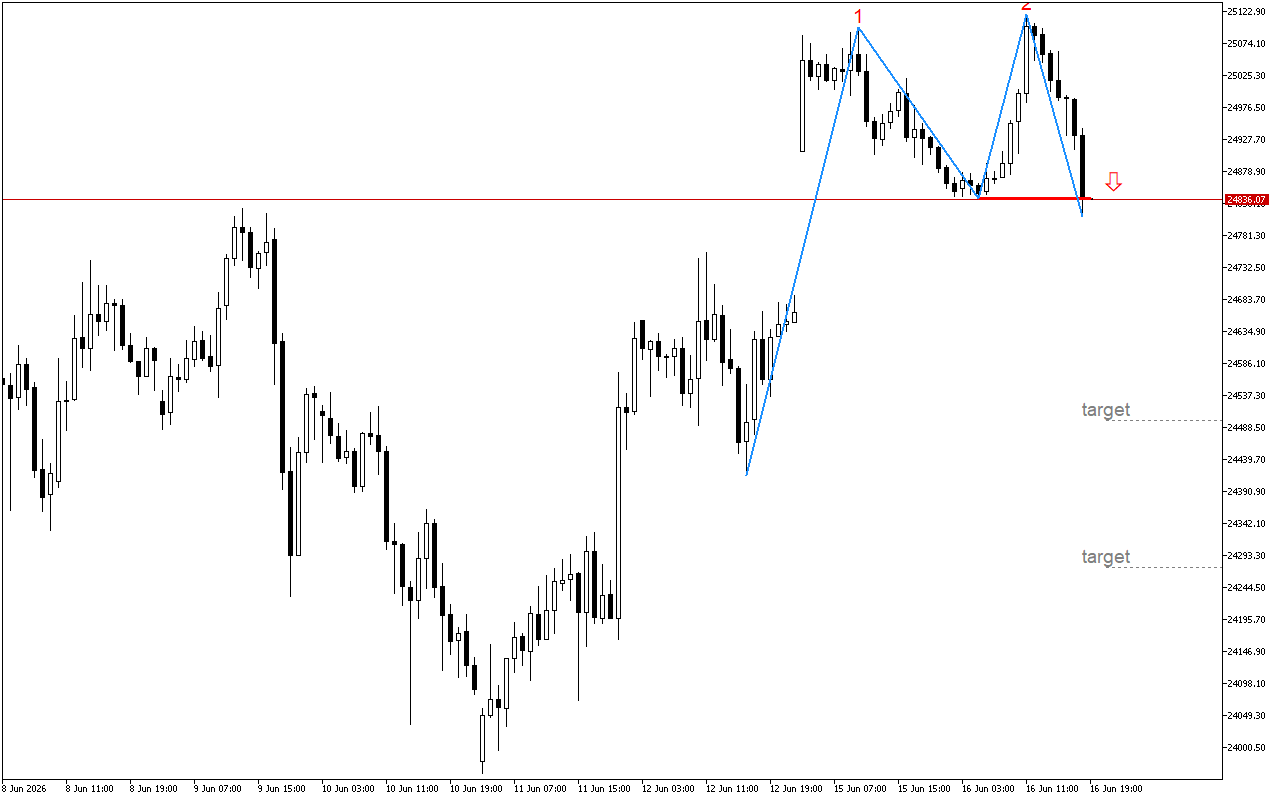
DAX 40 H1: The double top pattern signals a change in market sentiment
The DAX 40 chart shows signs of decaying upward momentum.The formation of a classic Double Top reversal pattern is observed on the chart. The main signal for confirmation of the…

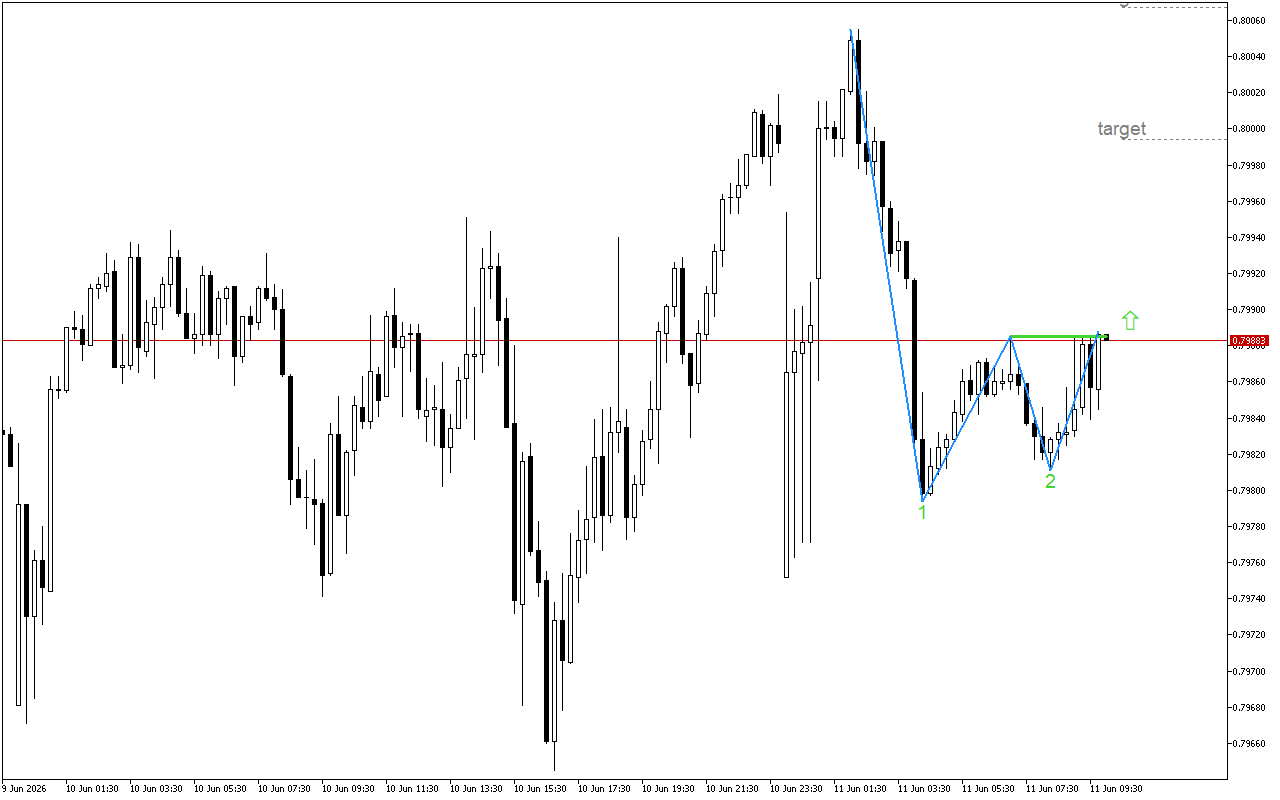
USDCHF M15: The Double Bottom pattern reduces the likelihood of continued downward movement
The balance of power in USDCHF is gradually improving. Market sentiment is becoming more positive for purchases.A Double Bottom pattern is being formed on the chart. The key element to…

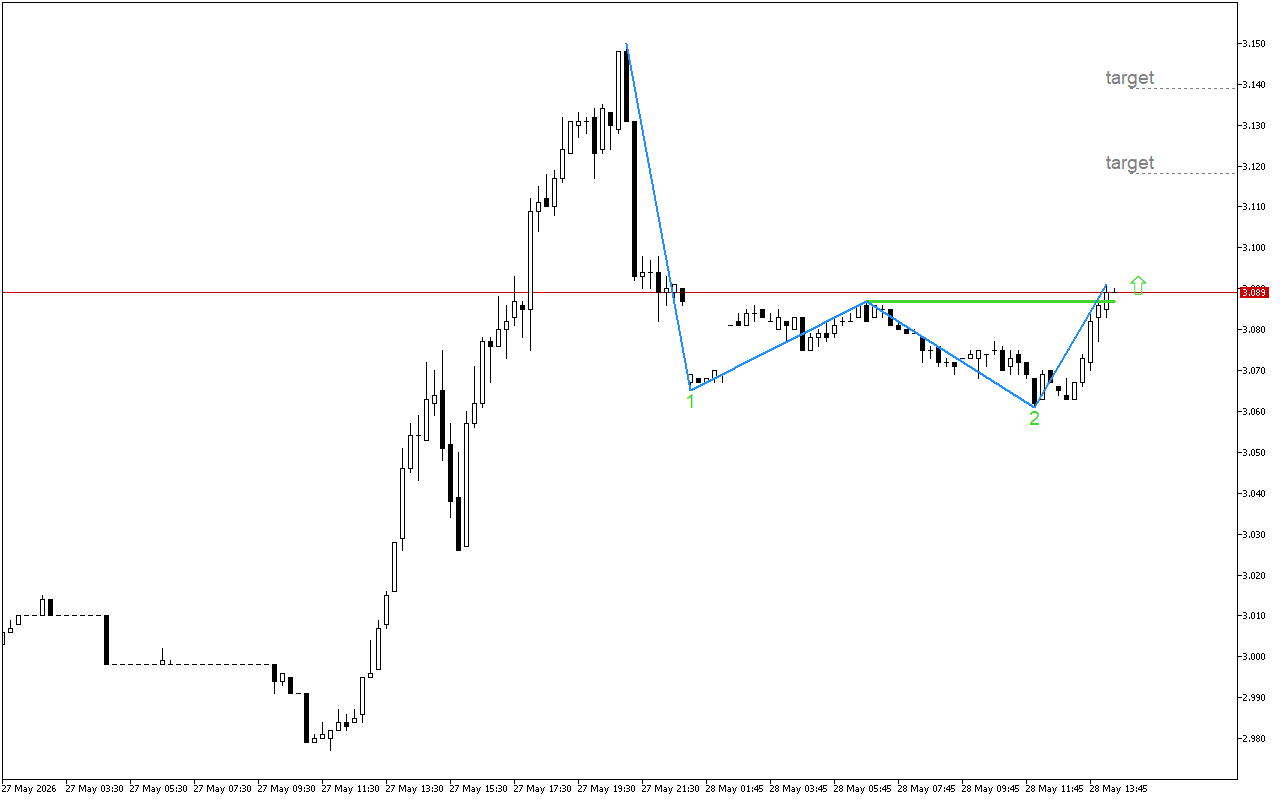
Natural Gas M15: Positive signals appeared on the chart
The pressure on Natural Gas is easing. This could lead to a reversal in the price movement.A Double Bottom pattern has formed on the chart, indicating a possible upward reversal.…

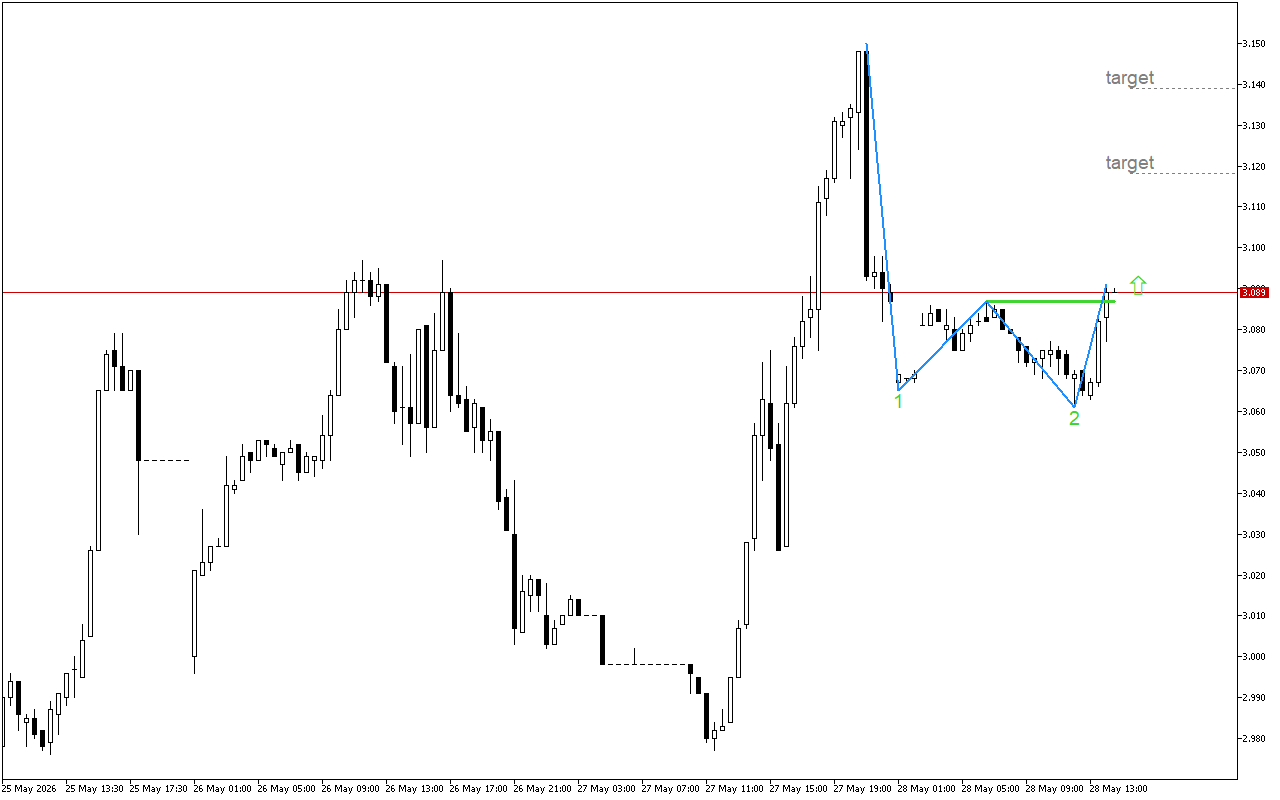
Natural Gas M30: The Double Bottom pattern signals the decaying of the downward pressure
The downward pressure is losing momentum. We may see a change in the direction of Natural Gas in the near future.A Double Bottom pattern is being formed on the chart.…
