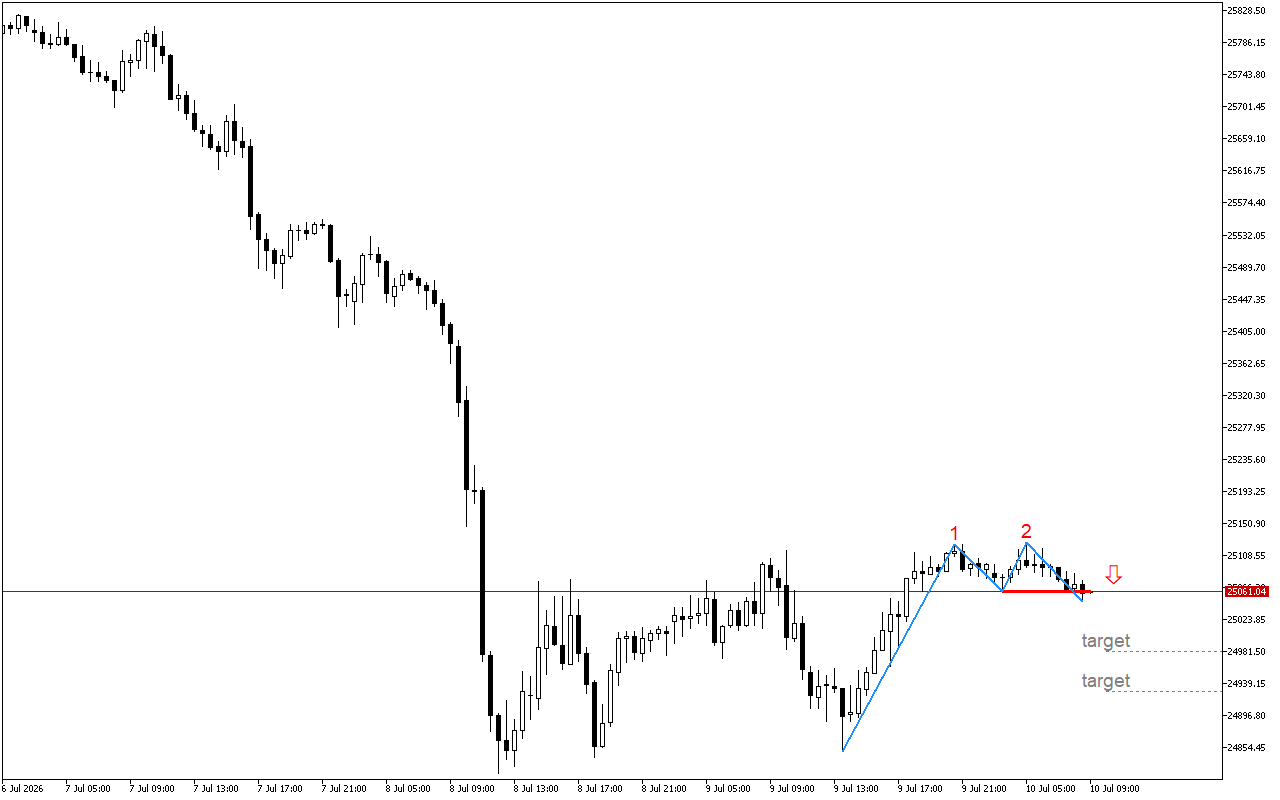
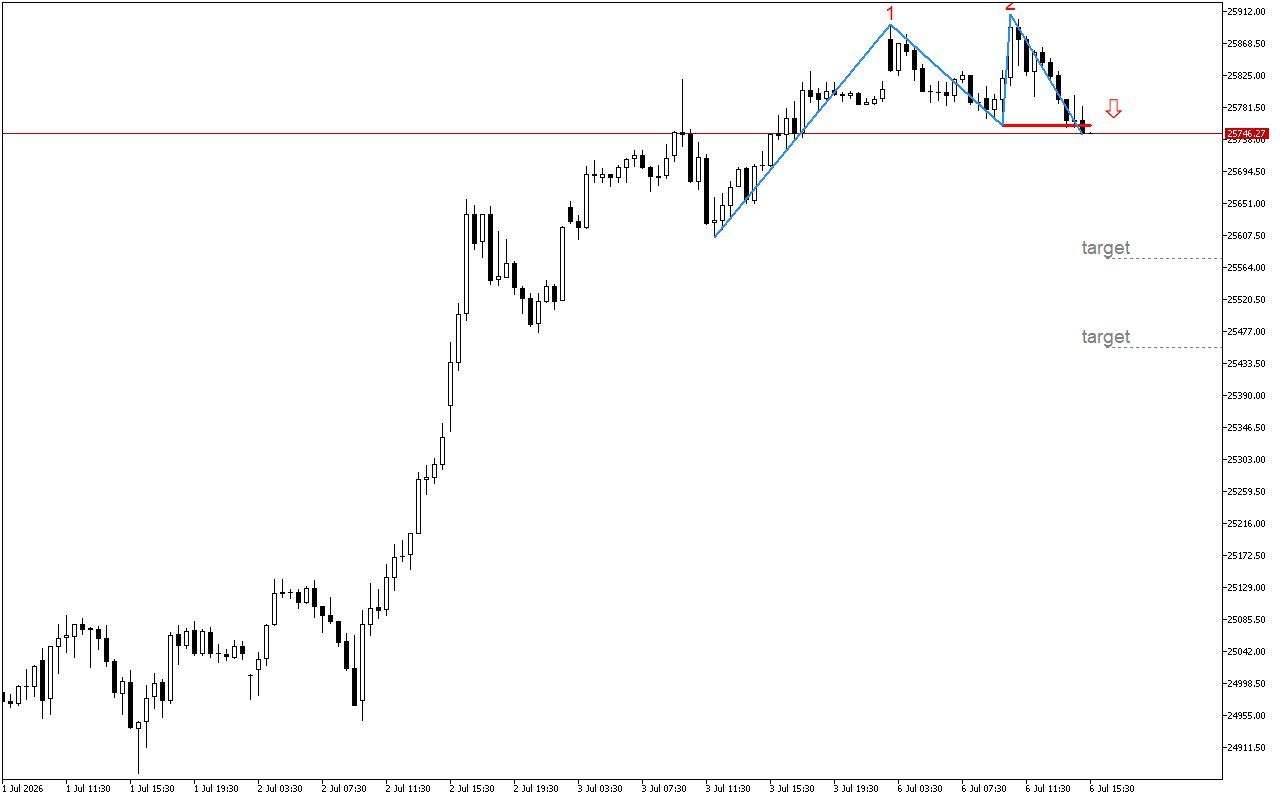
DAX 40 M30: After the formation of two tops of a technical pattern, the price breaks the neckline

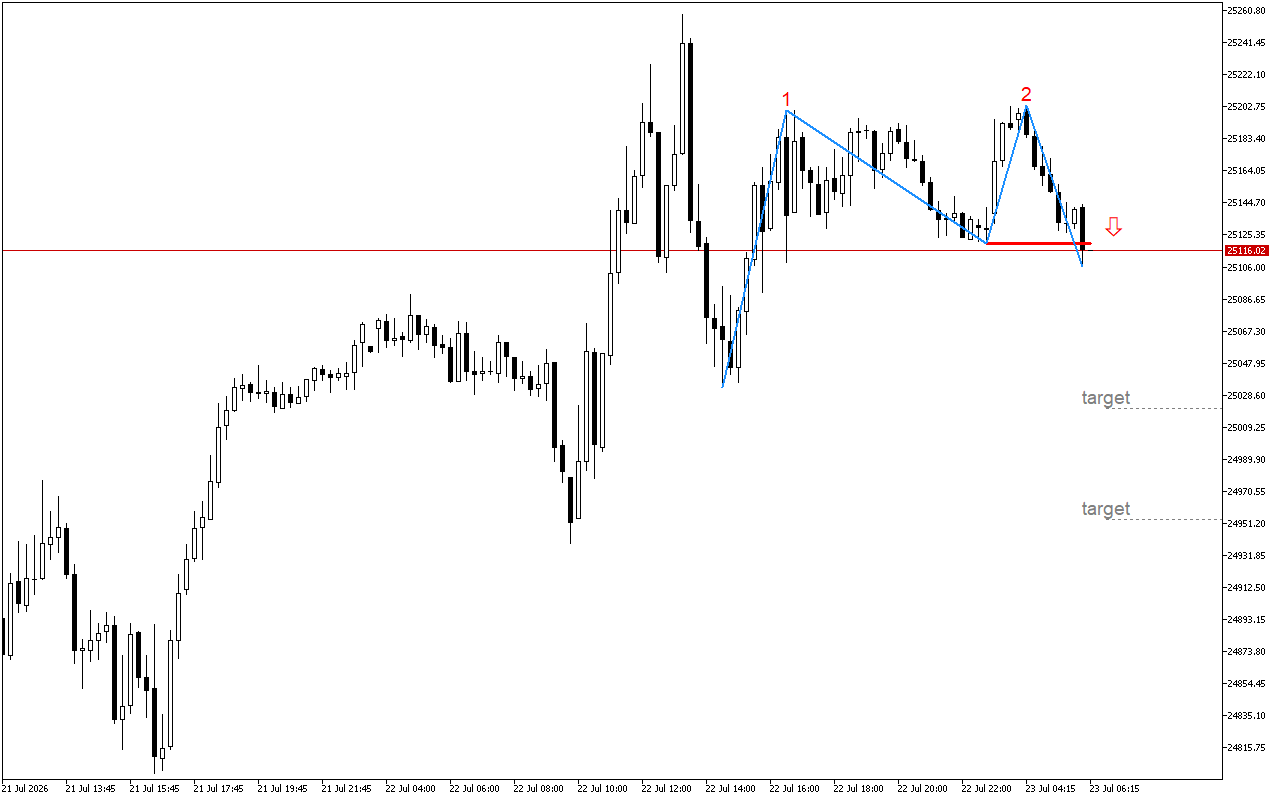
The DAX 40 chart shows the signs of weakening upward momentum. The formed patterns indicate a possible slowdown in growth momentum and an increase in the probability of a correction trend.
The formation of a classic Double Top reversal pattern is observed on the chart. The main signal for confirmation of the pattern is the breakthrough of the neckline, which was drawn through the minimum between the two peaks at the level 25756.62. Now the price has broken through this line, which confirms the reversal nature of the pattern.
When it comes to DAX 40 short positions now look more preferable. For aggressive trading, a trader can enter the market at the current prices. Advocates of a more conservative strategy should wait for the level to be retested.
📌 Entry: 25746.27
✔️ First target: 25575.84
✔️ Second target: 25455.32
❌ Stop order: 25907.27

  • Related Posts

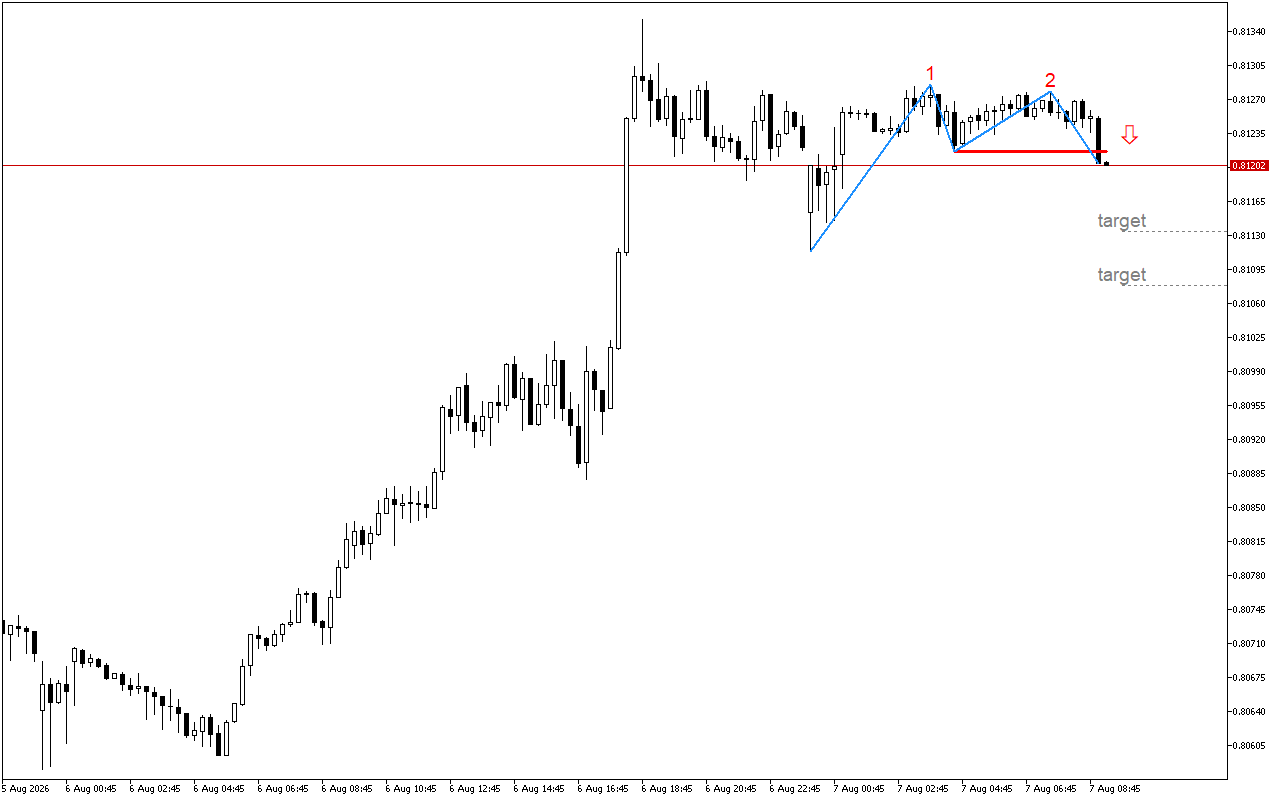
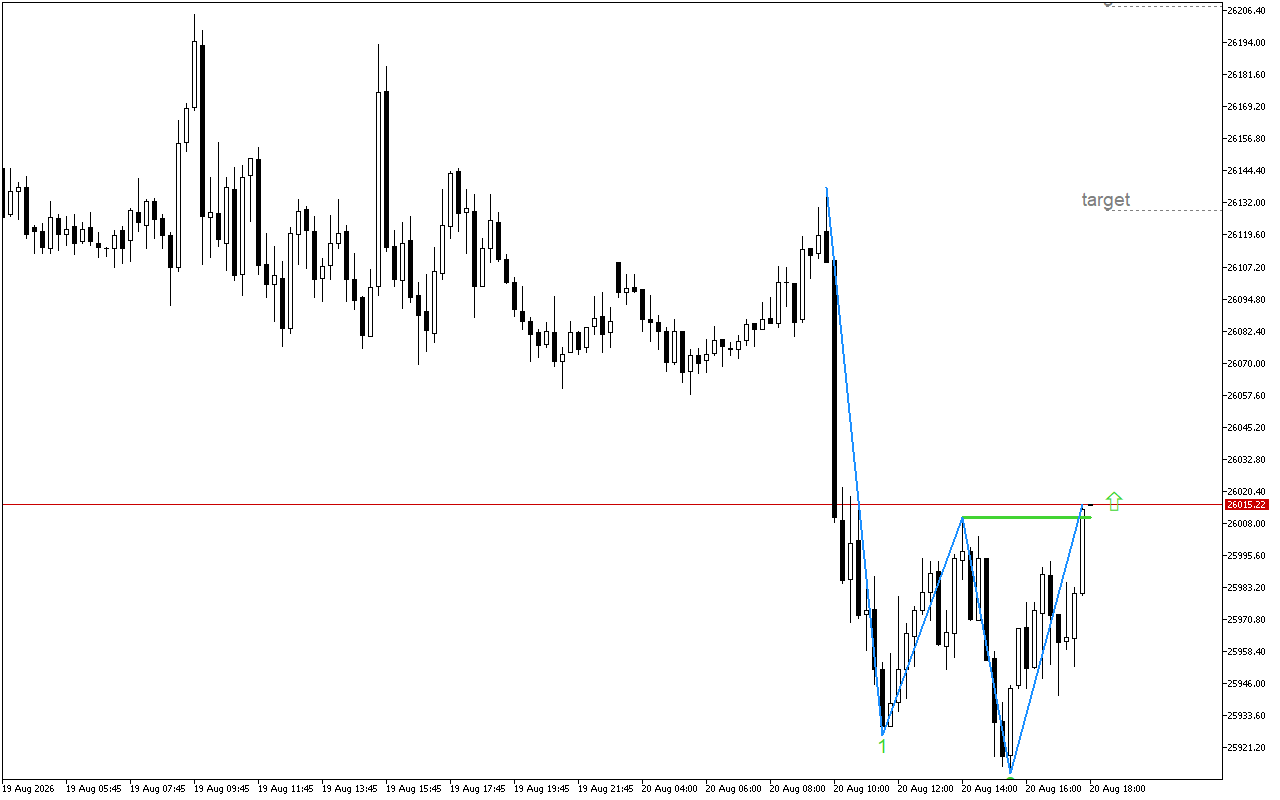
    DAX 40 H1: The pattern marked on the chart indicates a possible upward reversal

    The downward pressure is losing momentum. We may see a change in the direction of DAX 40 in the near future.A Double Bottom pattern has formed on the chart, indicating…

    Natural Gas M15: The graphic pattern signals a change in market sentiment

    In the current timeframe, there is a decrease in the selling interest. This may lead to the reversal of Natural Gas.A Double Bottom pattern has formed on the chart, indicating…

    Leave a Reply

    Your email address will not be published. Required fields are marked *

    You Missed

    DAX 40 M30: After the formation of two tops of a technical pattern, the price breaks the neckline

    • By
    • 7 hours ago
    • 4 views
    DAX 40 M30: After the formation of two tops of a technical pattern, the price breaks the neckline

    DAX 40 H1: The pattern marked on the chart indicates a possible upward reversal

    • By
    • 7 days ago
    • 13 views
    DAX 40 H1: The pattern marked on the chart indicates a possible upward reversal

    Natural Gas M15: The graphic pattern signals a change in market sentiment

    • By
    • 2 weeks ago
    • 30 views
    Natural Gas M15: The graphic pattern signals a change in market sentiment

    DAX 40 H1: The double top pattern signals a change in market sentiment

    • By
    • 3 weeks ago
    • 32 views
    DAX 40 H1: The double top pattern signals a change in market sentiment

    USDCHF M15: The Double Bottom pattern reduces the likelihood of continued downward movement

    • By
    • 4 weeks ago
    • 40 views
    USDCHF M15: The Double Bottom pattern reduces the likelihood of continued downward movement

    Natural Gas M15: Positive signals appeared on the chart

    • By
    • 1 month ago
    • 48 views
    Natural Gas M15: Positive signals appeared on the chart