Natural Gas M15: The graphic pattern signals a change in market sentiment

In the current timeframe, there is a decrease in the selling interest. This may lead to the reversal of Natural Gas.
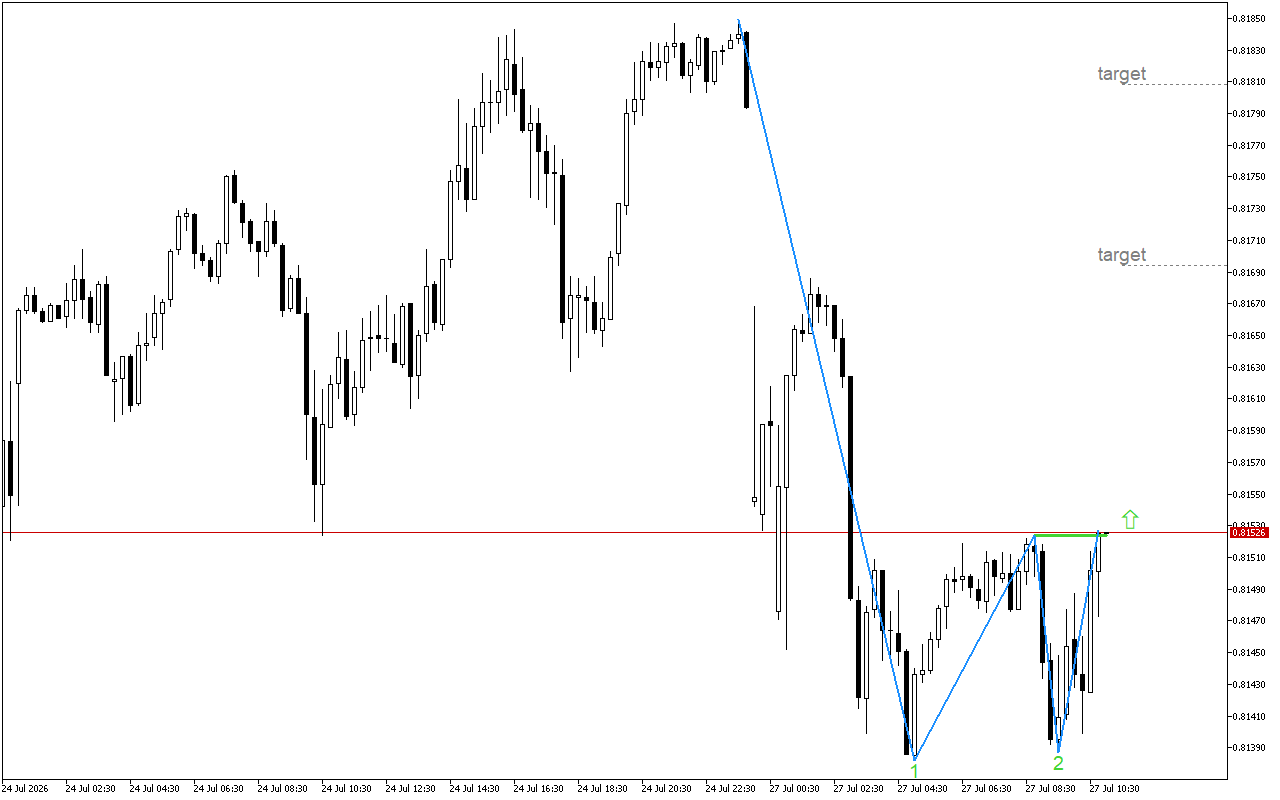
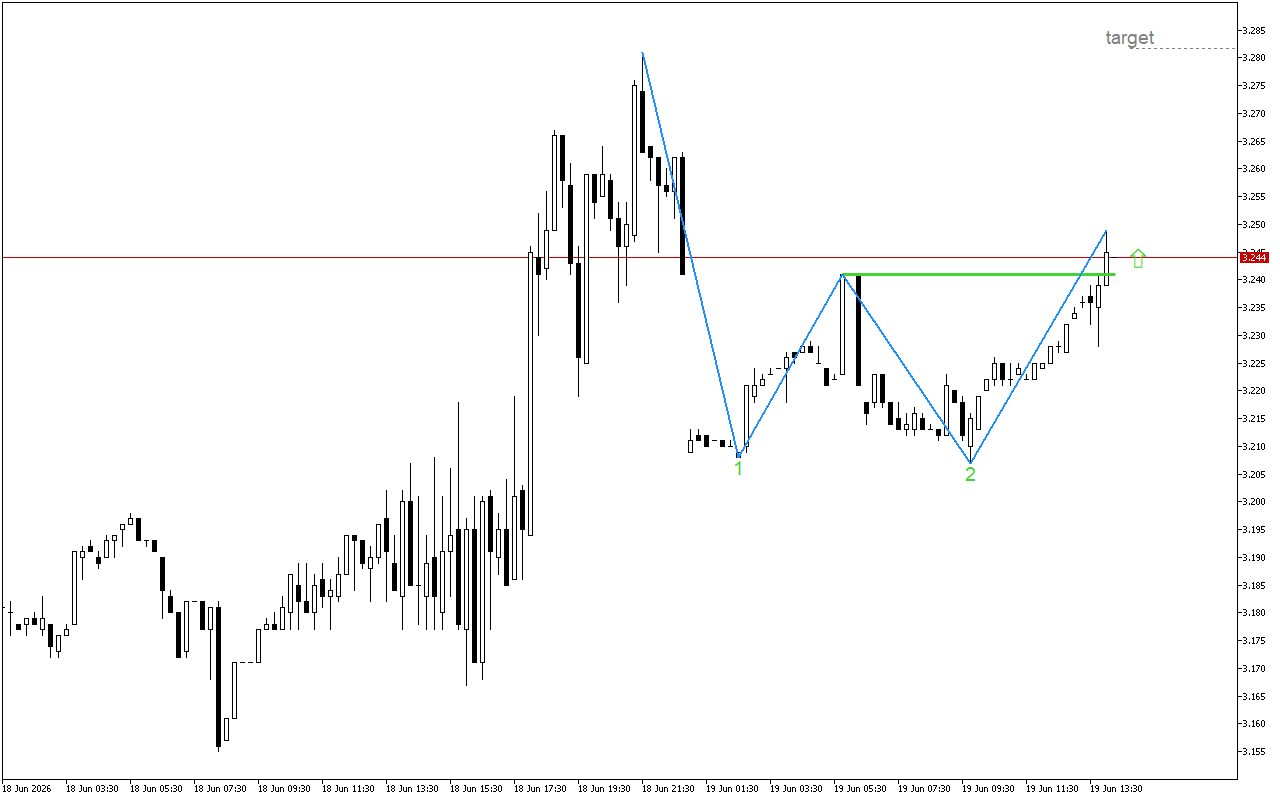
A Double Bottom pattern has formed on the chart, indicating a possible upward reversal. An important signal to confirm of this pattern is the breakthrough of the neck line located at the level 3.241. A breakdown of the neckline endorses a trend reversal scenario and opens up opportunities for further price growth. To do this, we must see the price consolidate above this line.
The chart prompts to focus on long positions in Natural Gas. It advocates entering the market at the current levels or while reaching the level, at which the retest occurs.
📌 Entry: 3.244
✔️ First target: 3.282
✔️ Second target: 3.309
❌ Stop order: 3.207

  • Related Posts

    USDCHF M15: The upward movement is weakening

    The pressure is easing. A support line has formed on the USDCHF chart.A Double Bottom pattern has formed on the chart, indicating a possible upward reversal. An important signal to…

    USDCHF M15: The Double Bottom pattern reduces the likelihood of continued downward movement

    The balance of power in USDCHF is gradually improving. Market sentiment is becoming more positive for purchases.A Double Bottom pattern is being formed on the chart. The key element to…

    Leave a Reply

    Your email address will not be published. Required fields are marked *

    You Missed

    USDCHF M15: The upward movement is weakening

    • By
    • 4 days ago
    • 11 views
    USDCHF M15: The upward movement is weakening

    USDCHF M15: The Double Bottom pattern reduces the likelihood of continued downward movement

    • By
    • 1 week ago
    • 15 views
    USDCHF M15: The Double Bottom pattern reduces the likelihood of continued downward movement

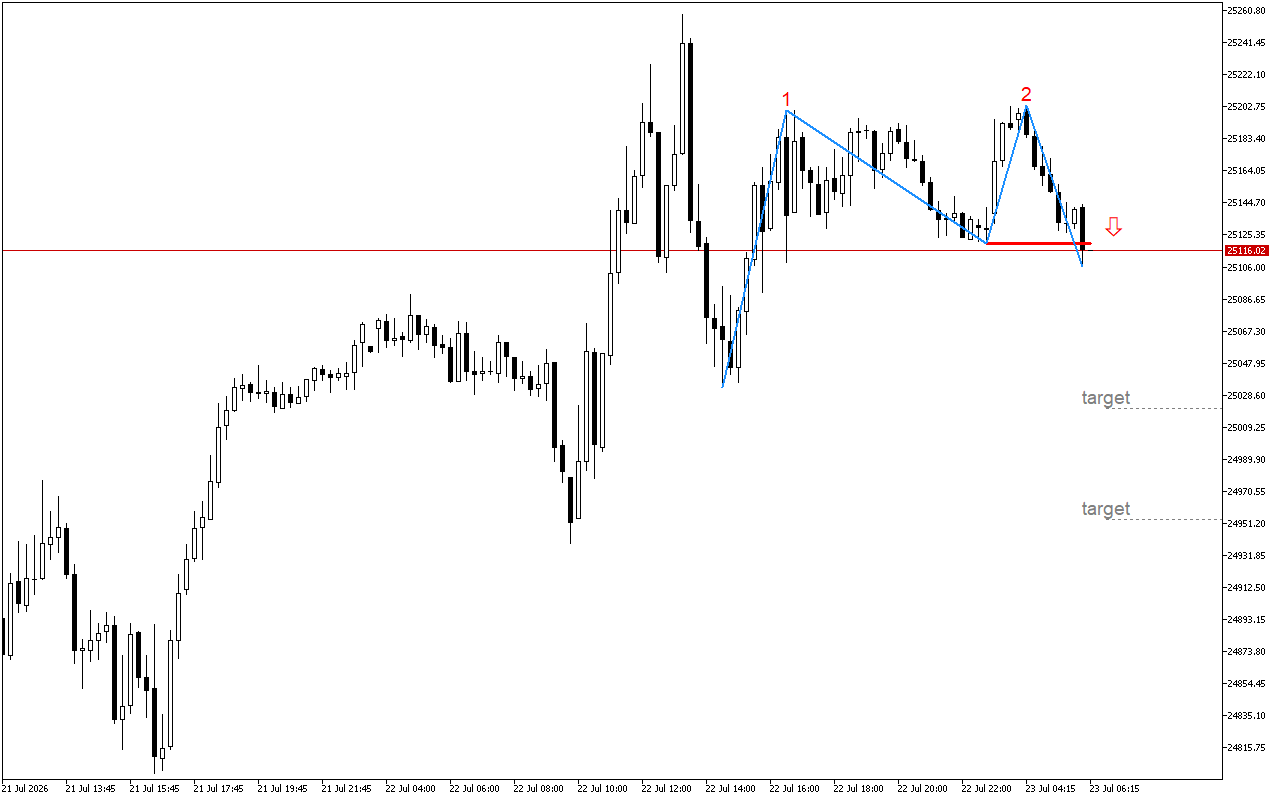
    DAX 40 M15: A reversal pattern has been formed

    • By
    • 2 weeks ago
    • 19 views
    DAX 40 M15: A reversal pattern has been formed

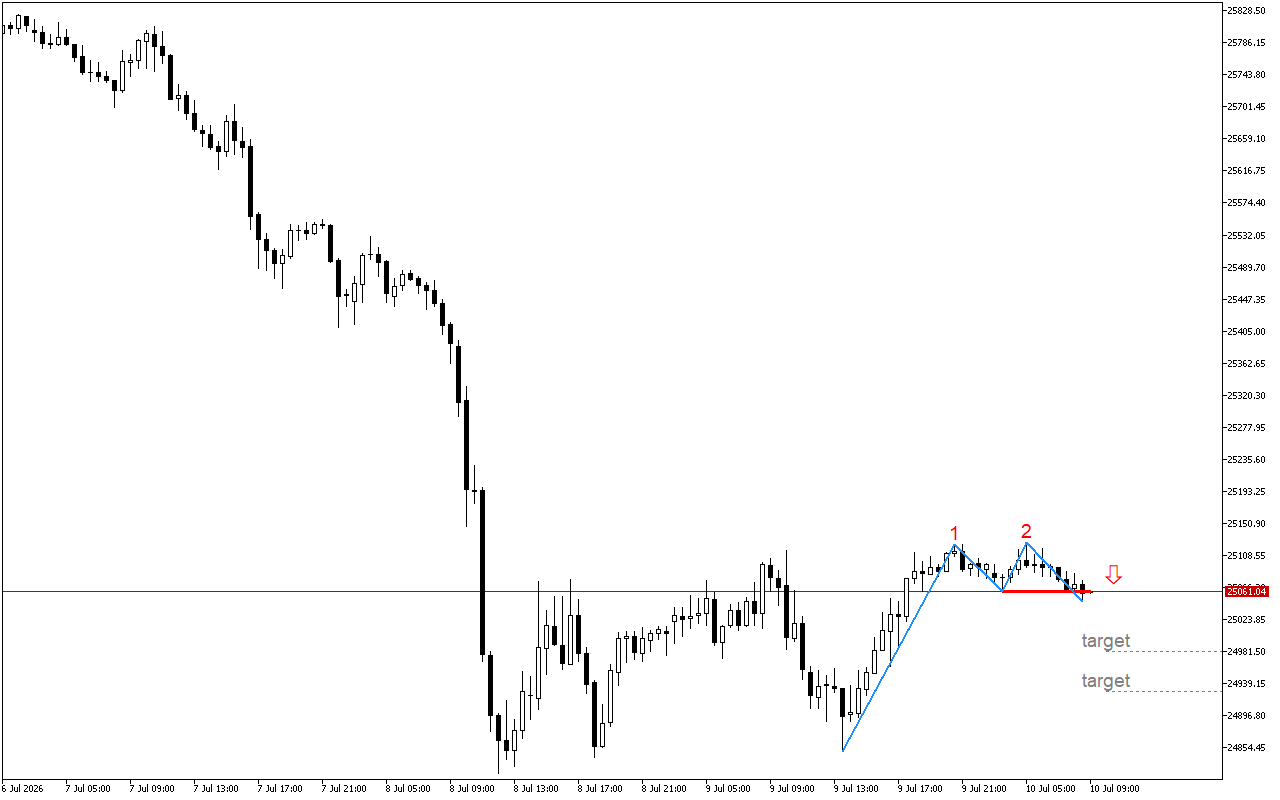
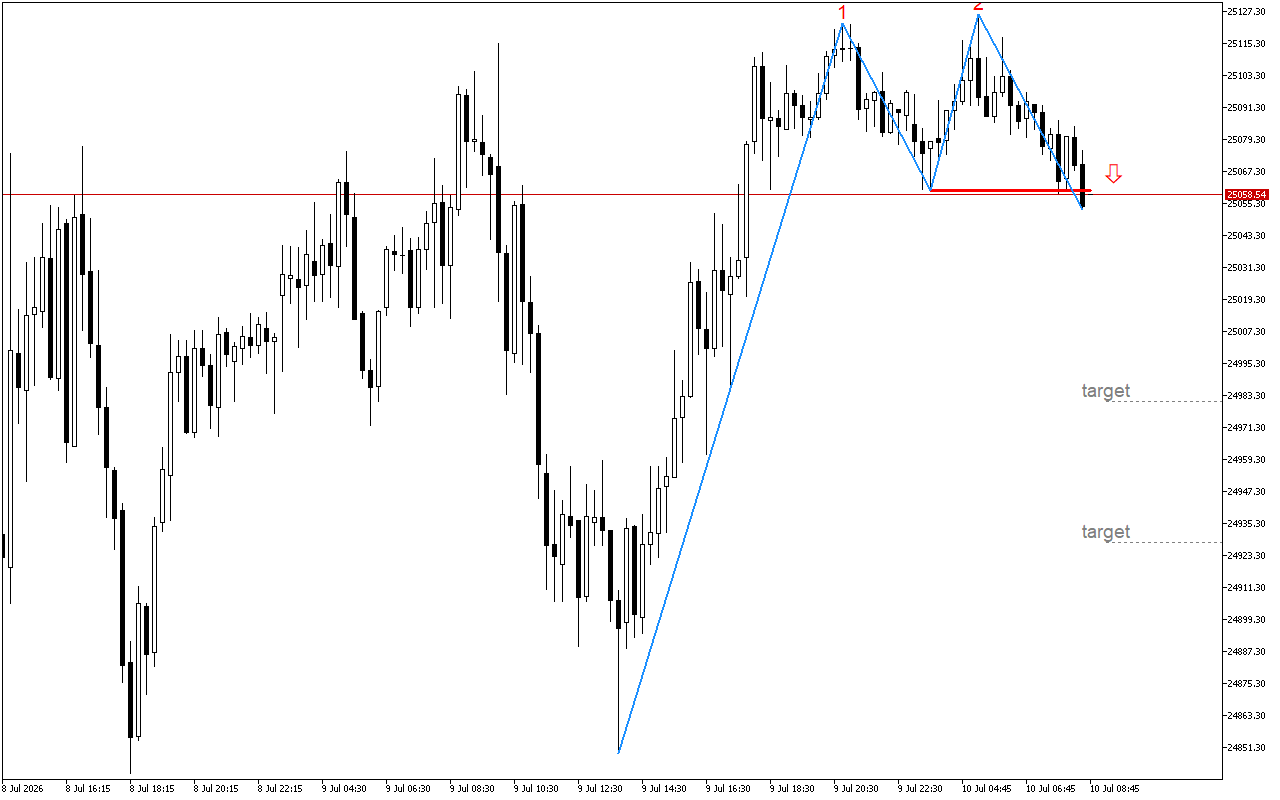
    DAX 40 M30: After the formation of two tops of a technical pattern, the price breaks the neckline

    • By
    • 4 weeks ago
    • 41 views
    DAX 40 M30: After the formation of two tops of a technical pattern, the price breaks the neckline

    DAX 40 M15: A reversal pattern has been formed

    • By
    • 4 weeks ago
    • 41 views
    DAX 40 M15: A reversal pattern has been formed

    DAX 40 M30: After the formation of two tops of a technical pattern, the price breaks the neckline

    • By
    • 4 weeks ago
    • 50 views
    DAX 40 M30: After the formation of two tops of a technical pattern, the price breaks the neckline