Natural Gas H1: The double top pattern formation indicates a likely increase of downward trend momentum

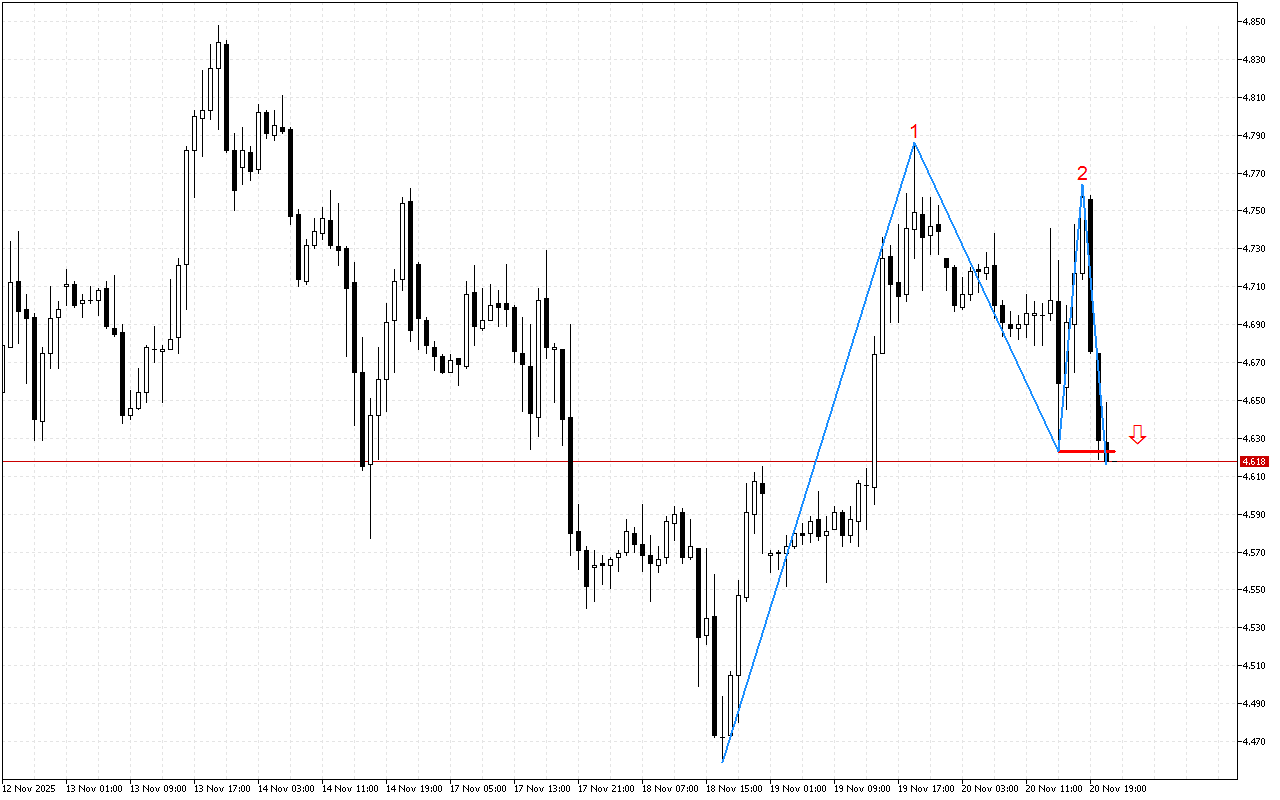
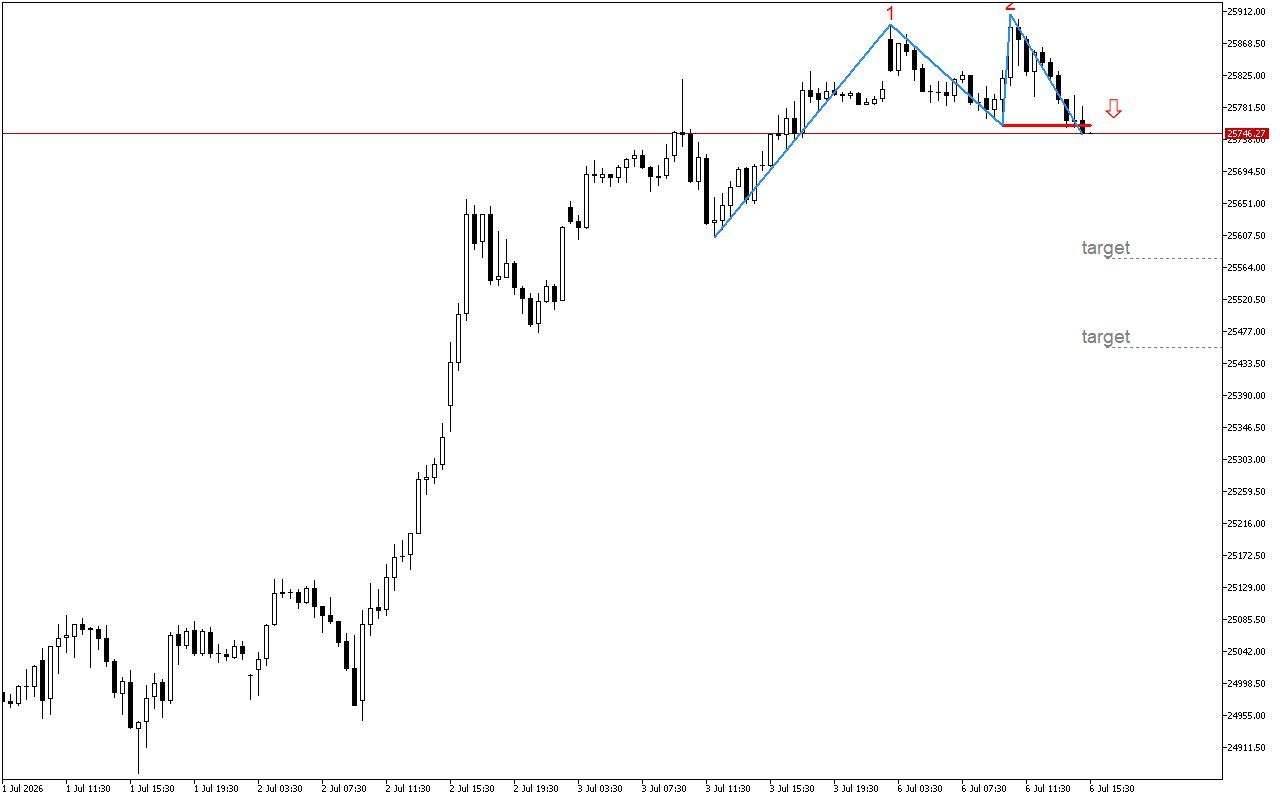
The Natural Gas chart shows signs of weakening of the current upward movement.
The formation of a classic Double Top reversal pattern is observed on the chart. The main signal for confirmation of the pattern is the breakthrough of the neckline, which was drawn through the minimum between the two peaks at the level 4.623. Now the price has broken through this line, which confirms the reversal nature of the pattern.
Short positions in respect to Natural Gas look more warranted strategically. More conservative traders may consider entering upon a retest of this level. With a more aggressive strategy, a trader can enter at or around the current prices.
📌 Entry: 4.618
✔️ First target: 4.427
✔️ Second target: 4.297
❌ Stop order: 4.786

  • Related Posts

    USDCHF M30: A downward reversal pattern has been formed

    The USDCHF chart shows signs of decaying upward momentum.A classic Double Top reversal pattern is being formed on the chart. The breakdown of the neckline at the level of 0.80231…

    USDCHF M30: The upward movement is weakening

    The pressure is easing. A support line has formed on the USDCHF chart.A Double Bottom pattern has formed on the chart, indicating a possible upward reversal. An important signal to…

    Leave a Reply

    Your email address will not be published. Required fields are marked *

    You Missed

    USDCHF M30: A downward reversal pattern has been formed

    • By
    • 1 day ago
    • 2 views
    USDCHF M30: A downward reversal pattern has been formed

    USDCHF M30: The upward movement is weakening

    • By
    • 2 weeks ago
    • 9 views
    USDCHF M30: The upward movement is weakening

    USDCHF H1: The upward movement is weakening

    • By
    • 3 weeks ago
    • 12 views
    USDCHF H1: The upward movement is weakening

    USDCHF M15: The Double Bottom pattern signals the decaying of the downward pressure

    • By
    • 3 weeks ago
    • 8 views
    USDCHF M15: The Double Bottom pattern signals the decaying of the downward pressure

    USDCHF M30: The Double Bottom pattern reduces the likelihood of continued downward movement

    • By
    • 3 weeks ago
    • 12 views
    USDCHF M30: The Double Bottom pattern reduces the likelihood of continued downward movement

    DAX 40 M15: Signals of a decay of the upward trend are detectable

    • By
    • 4 weeks ago
    • 13 views
    DAX 40 M15: Signals of a decay of the upward trend are detectable