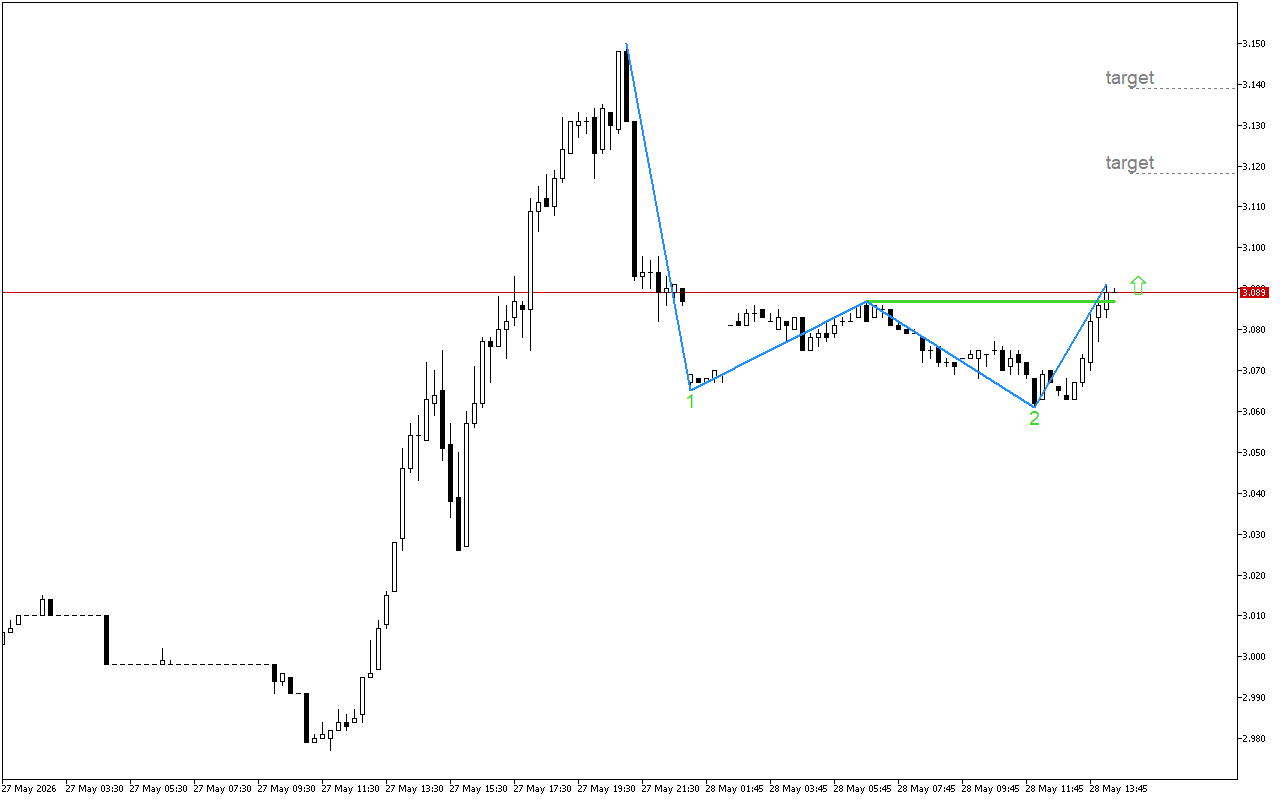
Natural Gas M15: Positive signals appeared on the chart

The pressure on Natural Gas is easing. This could lead to a reversal in the price movement.
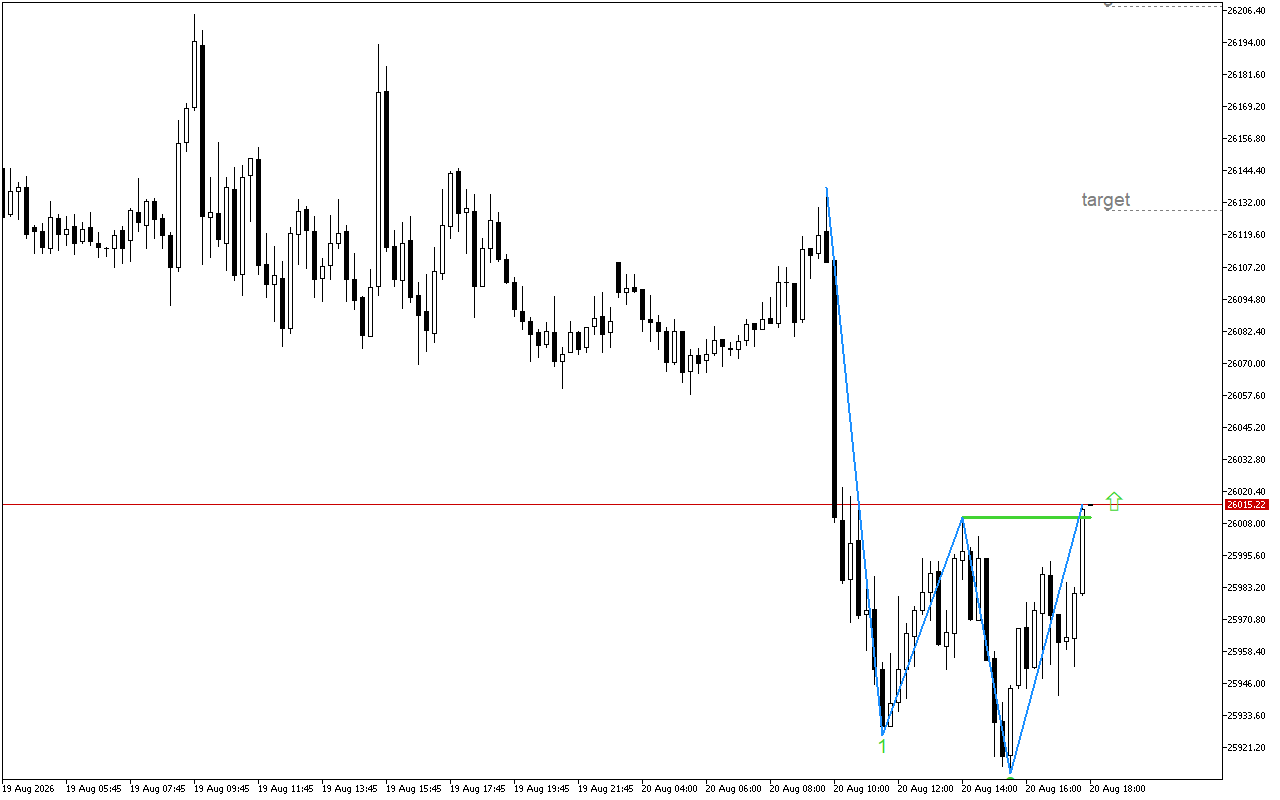
A Double Bottom pattern has formed on the chart, indicating a possible upward reversal. An important signal to confirm of this pattern is the breakthrough of the neck line located at the level 3.087. A breakdown of the neckline endorses a trend reversal scenario and opens up opportunities for further price growth. To do this, we must see the price consolidate above this line.
Currently, trading Natural Gas assumes the priority of long positions. A trader can enter the market both at the current levels or when retesting of the resistance level occurs.
📌 Entry: 3.089
✔️ First target: 3.118
✔️ Second target: 3.139
❌ Stop order: 3.061

  • Related Posts

    Natural Gas M30: The Double Bottom pattern signals the decaying of the downward pressure

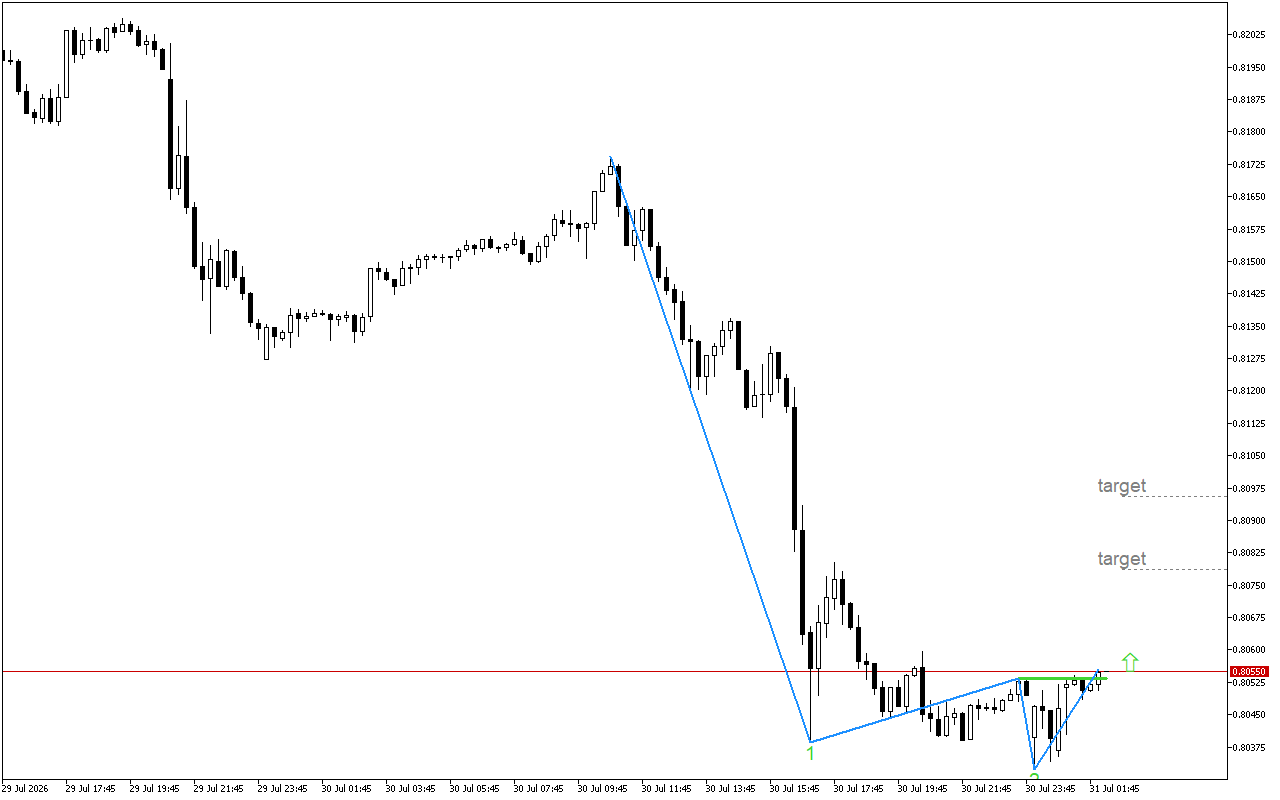
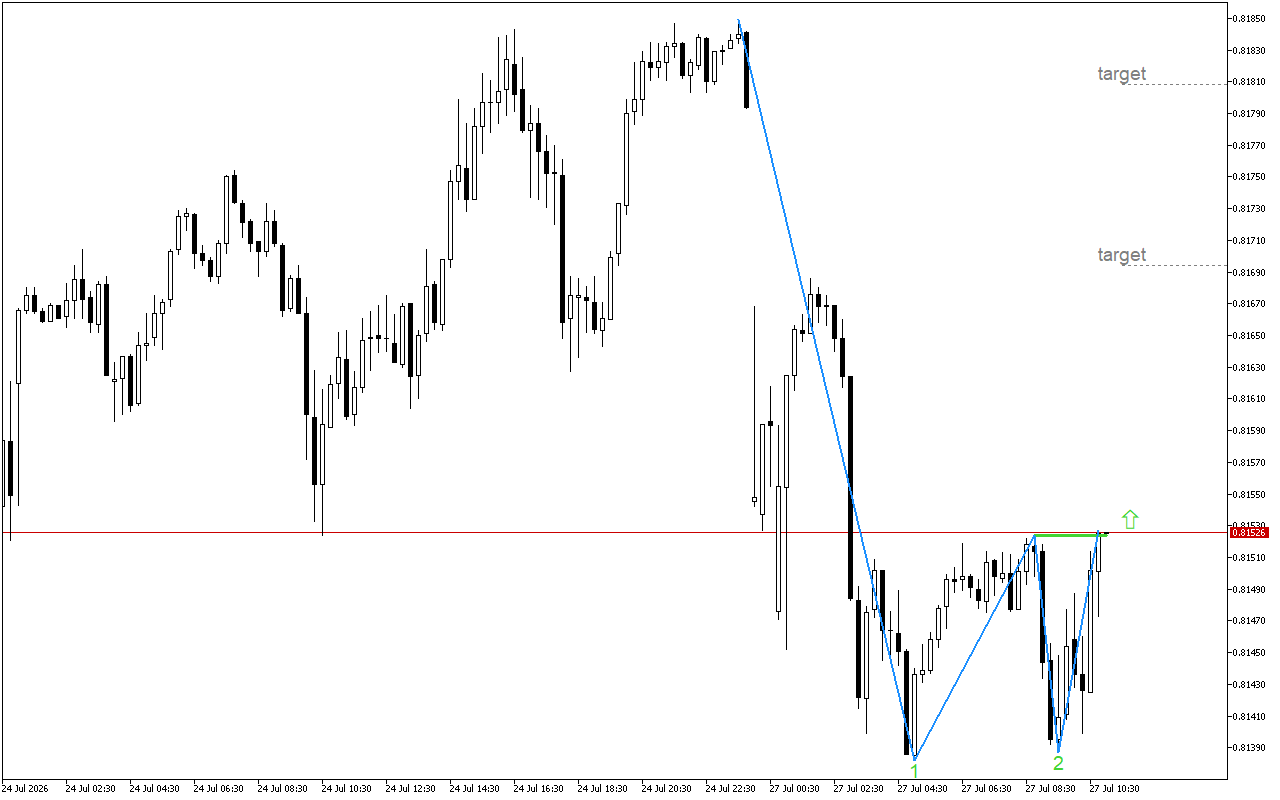
    The downward pressure is losing momentum. We may see a change in the direction of Natural Gas in the near future.A Double Bottom pattern is being formed on the chart.…

    Natural Gas M15: After the formation of the Double Bottom pattern, the price may regain growth

    The pressure on Natural Gas is easing. This could lead to a reversal in the price movement.A Double Bottom pattern is being formed on the chart. The key element to…

    Leave a Reply

    Your email address will not be published. Required fields are marked *

    You Missed

    Natural Gas M15: Positive signals appeared on the chart

    • By
    • 7 hours ago
    • 2 views
    Natural Gas M15: Positive signals appeared on the chart

    Natural Gas M30: The Double Bottom pattern signals the decaying of the downward pressure

    • By
    • 7 hours ago
    • 2 views
    Natural Gas M30: The Double Bottom pattern signals the decaying of the downward pressure

    Natural Gas M15: After the formation of the Double Bottom pattern, the price may regain growth

    • By
    • 1 week ago
    • 8 views
    Natural Gas M15: After the formation of the Double Bottom pattern, the price may regain growth

    USDCHF M15: Signals of a decay of the upward trend are detectable

    • By
    • 3 weeks ago
    • 20 views
    USDCHF M15: Signals of a decay of the upward trend are detectable

    DAX 40 M30: There are signs of weakness in the upward momentum

    • By
    • 2 months ago
    • 48 views
    DAX 40 M30: There are signs of weakness in the upward momentum

    USDCHF M15: The chart shows signs of fading upward movement

    • By
    • 2 months ago
    • 62 views
    USDCHF M15: The chart shows signs of fading upward movement